If you’ve changed your clock this March to compensate for Daylight Savings Time, did you notice a change in your sleep patterns? Research has shown that it won’t have much effect on your health other than making you a bit groggy. But, if you lose too much sleep, your immune system suffers, and you’re more susceptible to colds and viral infections. In the following 25 research studies that focus on sleep and your health, you’ll learn why napping is good — sometimes — and why a steady sleep pattern is best for your health.
This list is divided into two categories, one for adult sleep issues and another for infants through teens. In the latter category you may see issues that you worry about with your children, or you even may see yourself and how your current sleep patterns developed over time. Each graphic is linked to the article that will reveal more information about each study, so click on the images to learn more.
Sleep
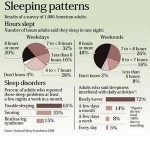 This graphic shows that, out of 1,000 American adults surveyed, 65 percent reported trouble sleeping, 33 percent snored, and 15 percent complained of restless leg syndrome during weekdays. Weekends? Sleeplessness rarely occurred for a full 72 percent of those surveyed.
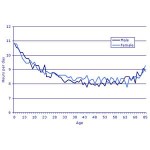 The Office for National Statistics in the UK showed that, on the whole, females slept longer than males on a nightly basis. This statistic was particularly true for the 30- to 60-year-old range. While people lose sleep time as they age, they pick it back up again in their 60s.
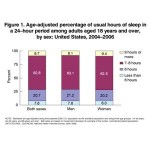 This graph, offered by the Centers for Disease Control (CDC), shows that the range of sleep is about equal between men and women in this study during a 24-hour period among adults aged 18 years and over in the U.S. between 2004-2006. Other graphs on this linked page show how sleep is affected by smoking.
 The National Heart Lung and Blood Institute offers information about a variety of diseases on this page. The one to note for sleep includes the increase in office visits to a physician for sleep disorders between 1990 and 2003. The visits for restless leg syndrome and for total sleep disorders has increased dramatically.
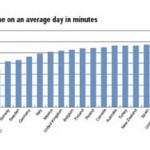 This interesting graph shows the amount of sleep that people claim to get on an international basis. According to this information, Koreans and the Japanese get by on less sleep than anyone else, while the French sleep far longer than their other earth neighbors…and the U.S. is right behind France.
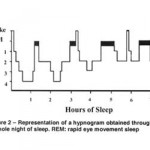 This graph represents the amount of REM (Rapid Eye Movement) hours that individuals might have during a full night’s sleep. Sleep evolves in cycles of NREM and REM phases, which, together, take approximately 90 minutes.
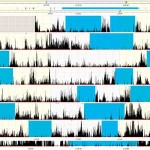 This image is linked to a page that contains several graphics. They show the sleep patterns for a normal sleep as compared to insomnia (shown here) or to “Shift Work Sleep Disorder.” For patients with sleep disorders, rest and activity data display an unstable or shifted pattern that is easy for doctors or nurses to see on an actogram.
 According to national health statistics, nearly 38,000 cardiovascular deaths annually are in some way related to sleep apnea. This graph is part of a series that shows how this disorder might be remedied.
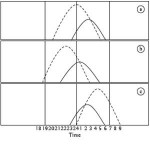 This diagram represents melatonin secretion (dashed line) and the sleep period (solid line) for a normal individual (top), individuals with advanced sleep phase (middle) and individuals with delayed sleep phase (bottom). In normal individuals, melatonin secretion begins about 10 p.m. and peaks about midnight when the person goes to sleep. In the morning, the individual awakens after the melatonin has worn off, and the person awakens feeling refreshed.
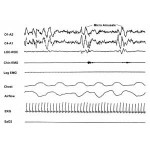 Snoring, according to the information on the page linked by this graphic, creates significant physiological disturbances in the snorer’s cardiovascular system and sleep structure that results in multiple problems including an increased risk for heart attack, angina, stroke and hypertension.
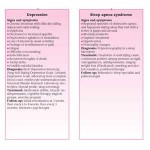 Wrong Diagnosis compares sleep apnea syndrome to depression and states that complaints of insomnia are subjective and require close investigation.
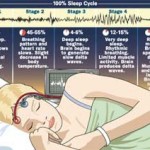 This image shows how a normal sleep cycle appears on a graph, including waking, awareness, light sleep, slow-wave sleep and deepest slow-wave sleep.
- Naps have had a bad rap for years, often seen as a sign of laziness and lack of productivity. But, napping lately has garnered new respect, as scientific evidence shows that napping benefits both mental acuity and overall health.
Children and Adolescents
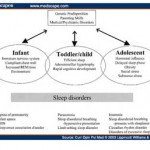 This graph at MedScape shows that there are an enormous variety of intrinsic and extrinsic factors that influence sleep disorder presentations on the developing child. These factors can influence subsequent stages of development.
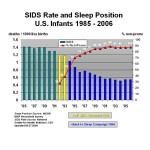 This graph depicts changes in sudden infant death syndrome (SIDS) incidence in the United States before and after the “Back to Sleep” campaign.
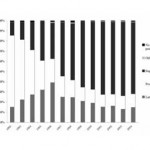 Linking sleeping position to the reduction in the number of SIDS deaths is important for continuation of SIDS risk reduction messaging and research. This graph demonstrates the change in position from prone to supine during the last 12 years.
 When you click on the image for this graphic, you’ll come to a page filled with various graphs and images that depict SID and infant mortality rates from a variety of sources. In this graph, which represents infant mortality rates in Virginia by region, you will see that the incidence of infant deaths decreased in all areas but the Southside between 2000 and 2008.
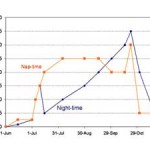 This graph shows the day-time and night-time sleep of a single infant, excluding motion-induced car-seat sleep and sleep with a parent. According to this scientist, a “normal” night’s sleep for an infant is approximately five hours.
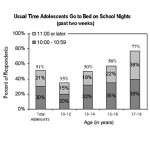 This graph shows the usual time adolescents go to bed on school nights according to age and time. There is another graph at this link that shows the usual time adolescents get out of bed on school days.
 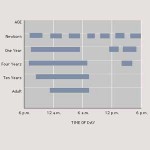 In this graph, the Charlotte-Mecklenburg School district in North Carolina shows parents that a newborn infant requires 16 to 18 hours of sleep a night, decreasing to 14 or 15 hours by age one, 10 or 12 by age four, and less than 10 by age ten.
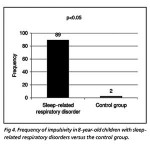 This graph shows a huge difference in impulsiveness in eight-year-old children with sleep-related respiratory disorders compared to a control group. In another chart on this page, this frequency between the group with sleep-related respiratory disorders and the control group narrows dramatically in the 10-year-old group.
 This girl is wearing a personal light-measuring device, called a Daysimeter, a devise that monitors her rest and activity patterns and the amount of circadian light — short-wavelength (blue) light — reaching her eyes. Scientists discovered that if you remove blue light in the morning, it delays the onset of melatonin, the hormone that indicates to the body when it’s nighttime.
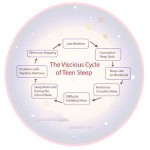 This graphic displays the vicious cycle involved with teen sleeping patterns, one that often includes afternoon napping, late bedtimes, cumulative sleep debt and sleeping late on weekends. However, that weekend sleep reinforces the circadian delay that means the teen will have trouble sleeping again on Monday.
 This colorful graphic shows that insufficient sleep can lead to a number of behaviors in the classroom that are disruptive and worrisome, including distraction, defiance, anxiety, depression, easy frustration and irritability. According to this blog, the typical preschooler needs at least 11-12 hours of sleep.
 In this graph, you’ll learn that, under the influence of the sudden surge of sex steroid hormones, the circadian clock phase advances in teen years. It persists in this state until one is almost 30 years old. After that, it settles into its adult pattern. But, age-dependent changes of chronotype are different for males and females.


